Your KPI is 87%. Now Ask Why?
'%20fill='%230A2841'%3e%3cg%20id='Group-23'%20transform='translate(1030,%20300)'%3e%3cg%20id='Group-22'%20transform='translate(0,%2015)'%3e%3crect%20id='Rectangle-Copy-6'%20fill-opacity='0.08'%20x='0'%20y='0'%20width='36'%20height='36'%20rx='15'%3e%3c/rect%3e%3cg%20id='Group-3-Copy-10'%20transform='translate(14,%2011)'%3e%3cpath%20d='M1.48030663,7.00622181%20L0,7.00622181%20L0,4.54113581%20L1.47413869,4.54113581%20C1.47413869,4.01634435%201.4507005,3.52367128%201.48092343,3.03386591%20C1.50559521,2.63812154%201.54383646,2.23147985%201.66472817,1.85466237%20C2.01506741,0.761490221%202.84959027,0.135181726%204.05048903,0.0382530307%20C5.00096925,-0.0380281321%205.96501894,0.0233409237%206.94078773,0.0233409237%20L6.94078773,2.40813096%20C6.43008195,2.40813096%205.92986166,2.40755742%205.42964138,2.40813096%20C4.82209886,2.40927805%204.61238876,2.60428252%204.60868799,3.1778251%20C4.60622081,3.6183058%204.6080712,4.0587865%204.6080712,4.53540038%20L7,4.53540038%20C6.90686404,5.37449317%206.81804564,6.17515861%206.72676007,7.00105992%20L4.61979029,7.00105992%20L4.61979029,14%20L1.48030663,14%20L1.48030663,7.00622181%20Z'%20id='Fill-1'%3e%3c/path%3e%3c/g%3e%3c/g%3e%3c/g%3e%3c/g%3e%3c/g%3e%3c/svg%3e)


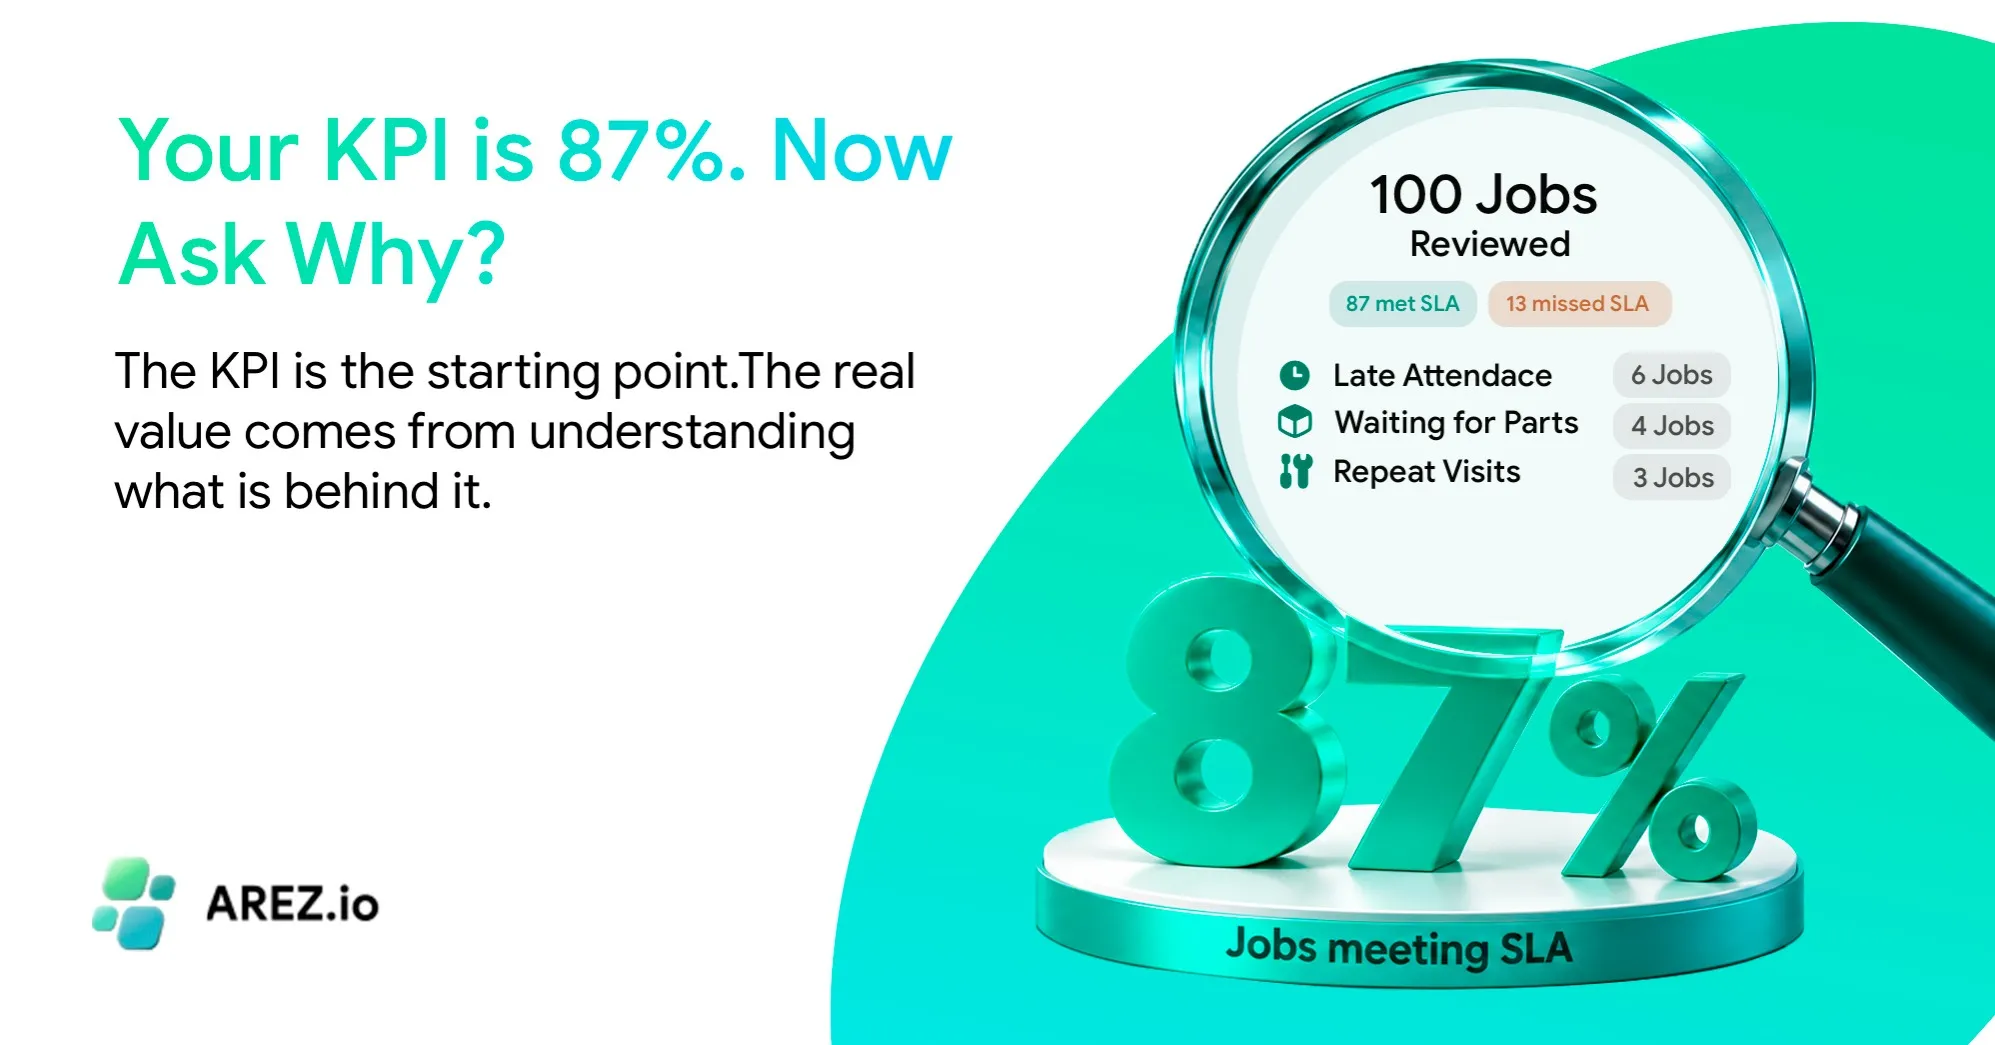
The KPI is the starting point. The real value comes from understanding what is behind it.
Most operational businesses rely on KPIs to understand how the operation is performing. SLA performance, response times, compliance, job completion, attendance, costs and customer satisfaction all provide useful measures.
But a KPI only tells part of the story. If a KPI shows that 87% of jobs are meeting their SLA, you know there is a gap. What it doesn’t tell you is which jobs are causing it, which sites are affected or whether the same problems are happening repeatedly.
The same applies to other areas of the operation. A compliance figure might show that performance has dropped, but not which records are causing the issue. Rising reactive costs tell you that something has changed, but not which sites or assets are behind it.
The number is useful. It’s just not the whole answer.
A KPI gives you the result. What’s behind it?
KPI dashboards are useful for showing how the operation is performing, but the number itself doesn’t explain what is driving the result.
Imagine seeing an SLA performance KPI of 87%. The useful next question is: Which jobs are at risk of breaching their SLA?
That takes you beyond the headline figure and into the detail. You can see which jobs are contributing to the result, which sites are affected and whether the same pattern is appearing more than once.
The same applies across the operation. If reactive maintenance costs are increasing, you might want to understand why a particular site keeps generating reactive jobs. If compliance performance is dropping, you might want to know which workers or suppliers are creating the gap, which certificates are missing or what is about to expire.
The KPI tells you where to look. The detail tells you what’s happening.
This is where AI changes the experience. The information behind a KPI is often already sitting in the system. The challenge is getting to it quickly enough to make it useful.
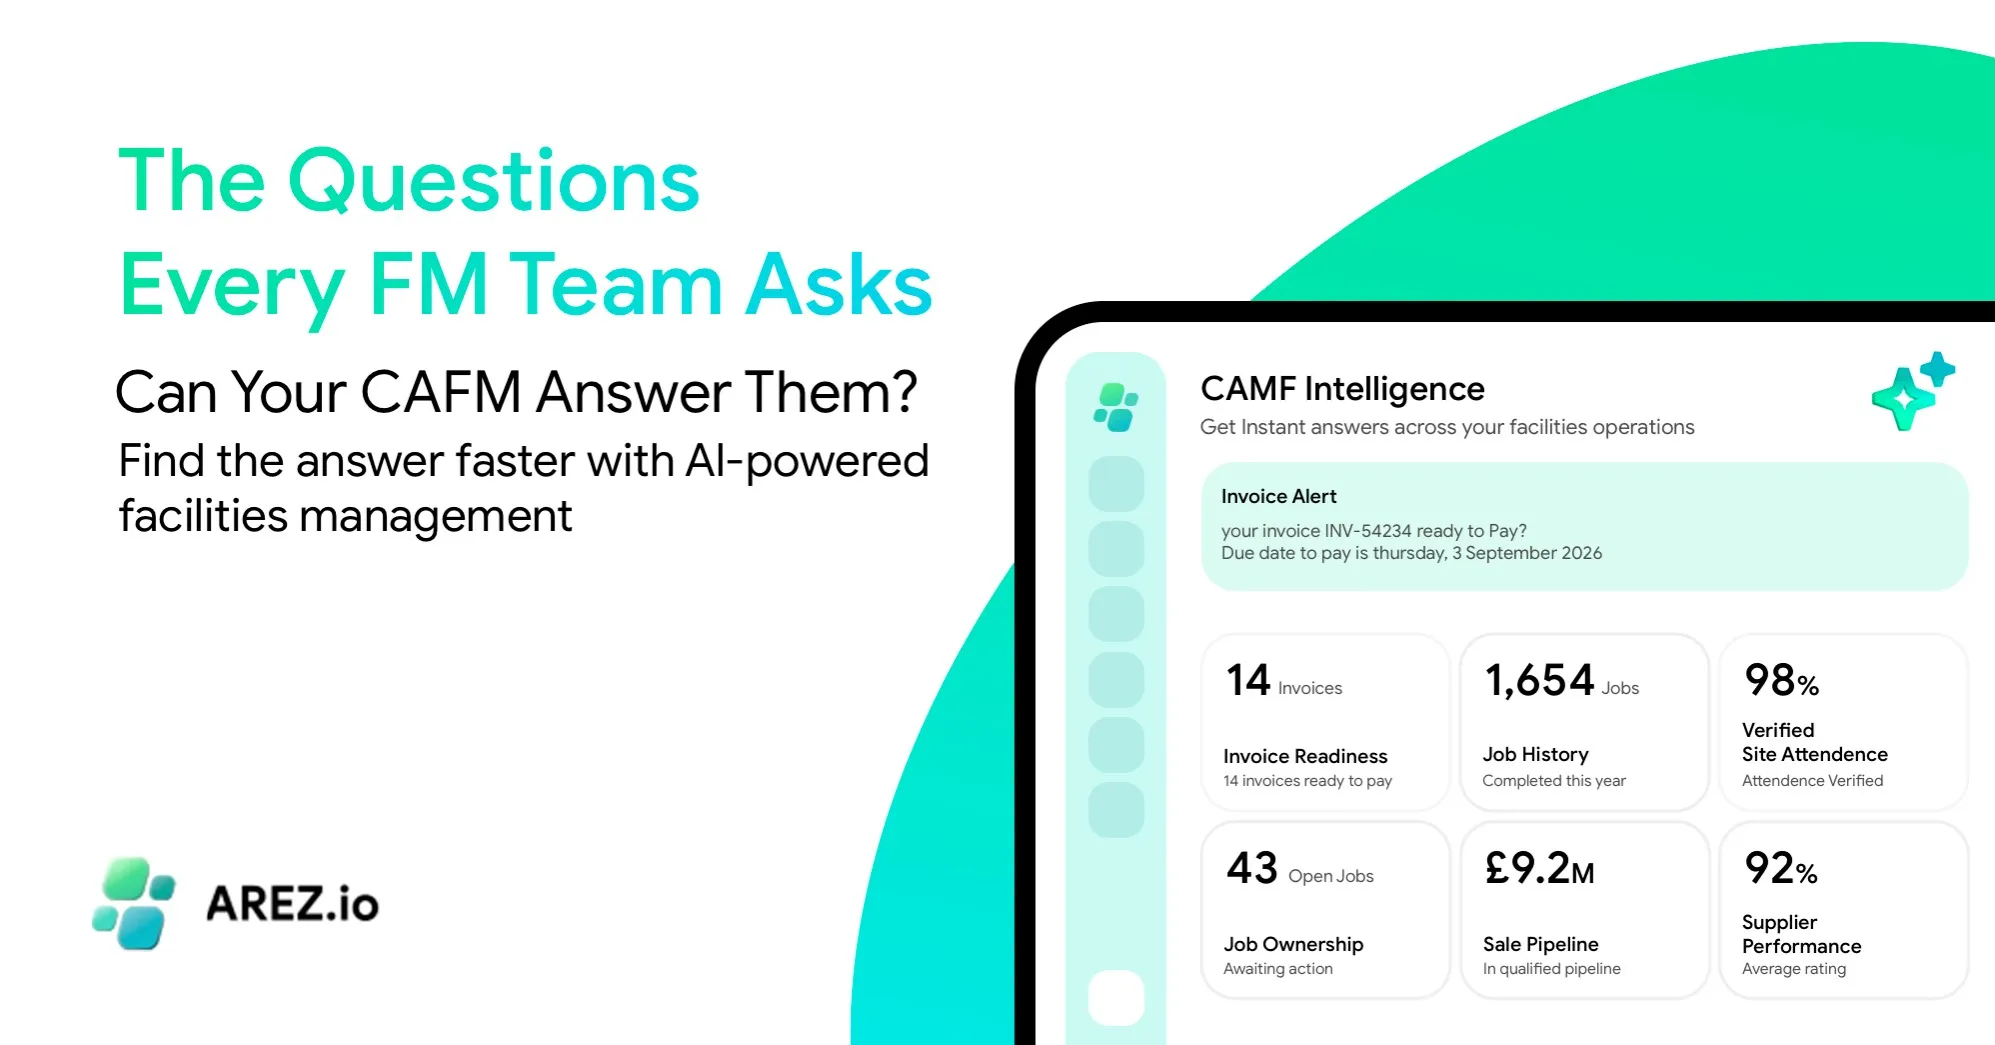
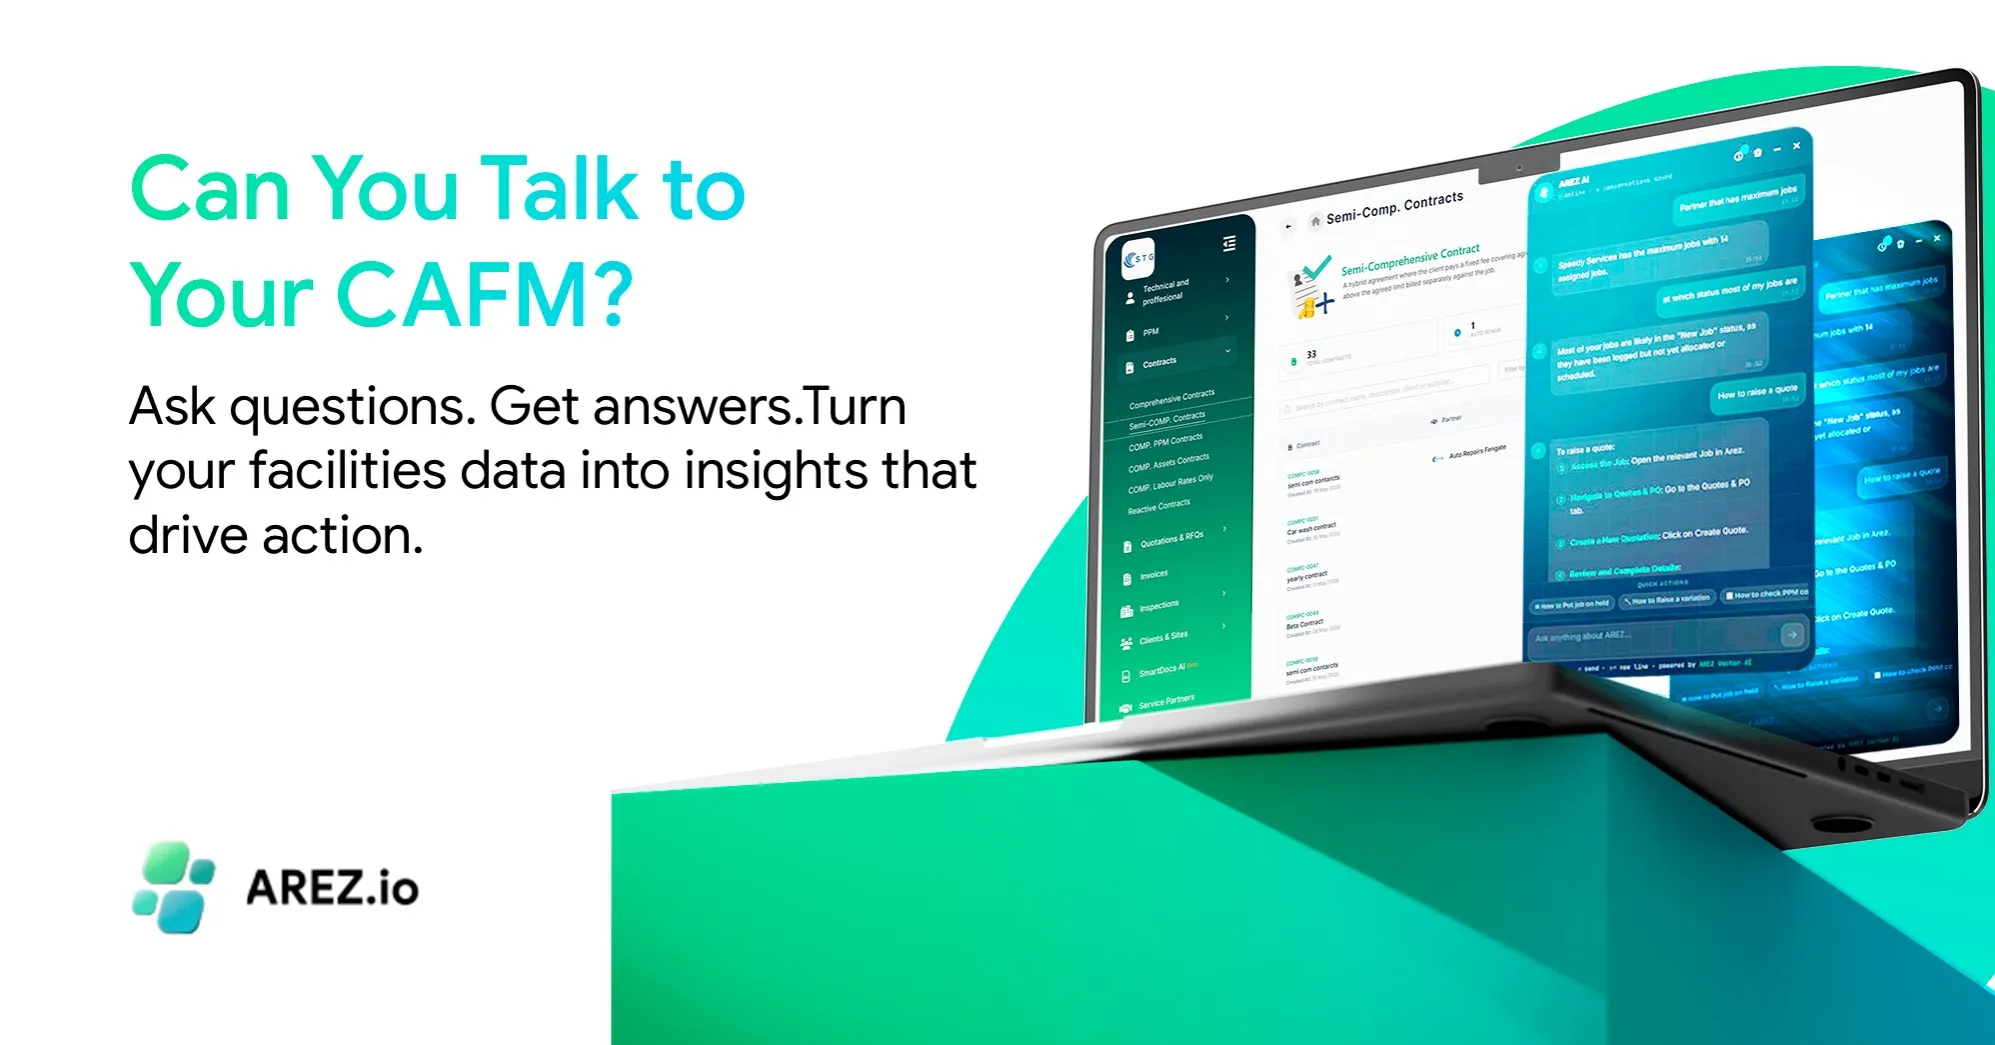
Arez brings operational information together across jobs, assets, suppliers, workforce activity, compliance and service delivery. AI provides another way to work with that information, allowing you to ask questions and explore what is happening across the operation.
For example:
- Which jobs are at risk of breaching their SLA?
- Why does this site keep generating reactive jobs?
- Which sites aren’t compliant, and which certificates are missing?
The value is not simply being able to ask a question. It is being able to move from the headline result into the information behind it without turning the investigation into another manual task.
Make your KPIs work harder
Once you know what is behind the score, you can do something about it.If certain jobs are driving an SLA risk, you can prioritise them or reassign the work. If compliance issues are coming from a small number of sites, you can see what is missing and address it. If a pattern is emerging across the operation, you can act on it before it becomes a bigger problem.
The KPI shows you where to look. The detail shows you what to do.
Most businesses already have the data they need. The challenge is turning that data into something useful when a decision needs to be made. Arez brings operational data and workflows together, while AI gives teams another way to explore what is happening across the operation and understand what sits behind the numbers.
Your KPI is 87%. Now ask why.
Find out how Arez helps turn operational data into better decisions.